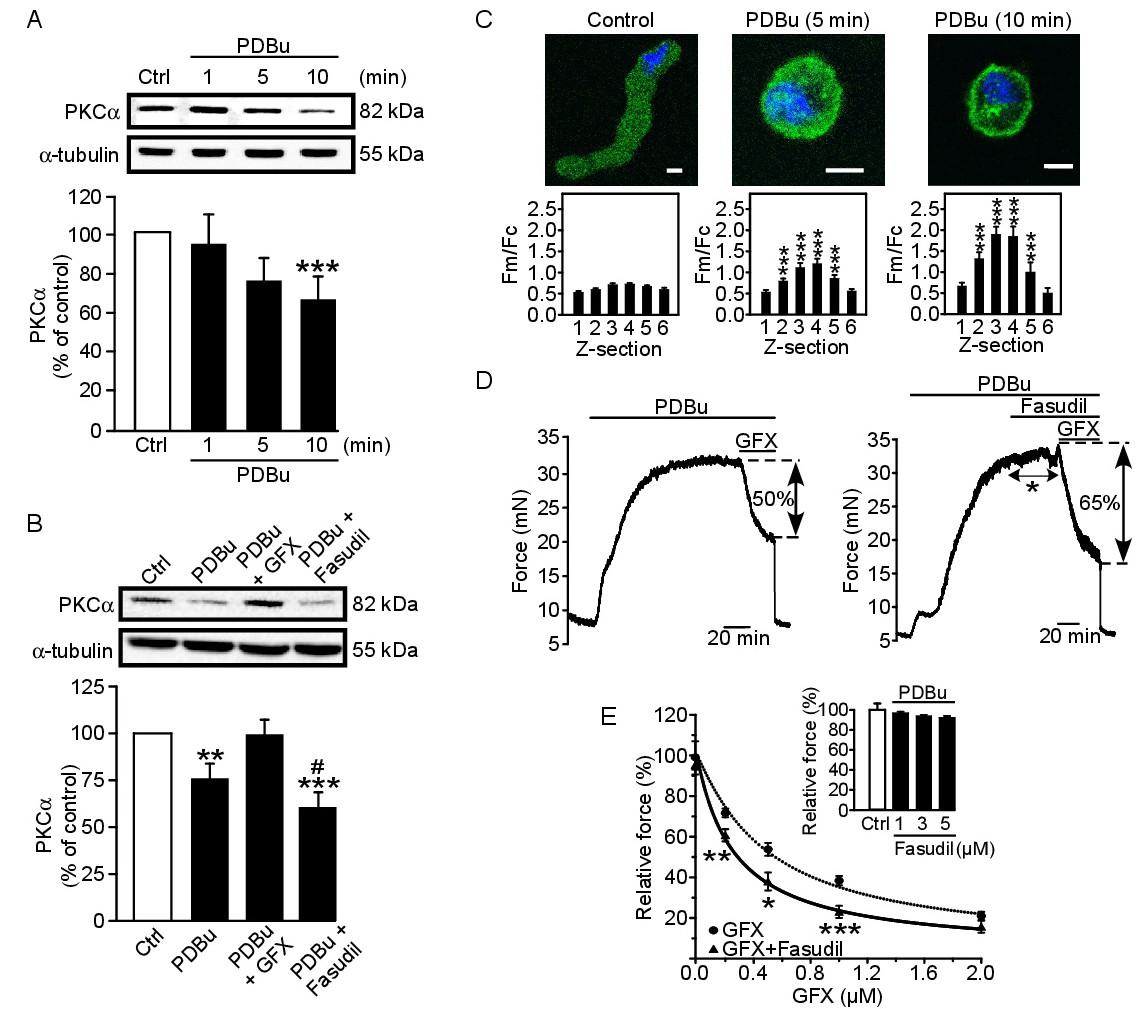
Fig. 6. Analysis of the role of PKCα and RhoA/ROCK in PDBu-treated rat femoral arterial rings. (A) Representative immunoblot (top) and analysis (bottom) showing PKCα levels in cytosolic fractions during stimulation with PDBu (0.2 µM) (n = 5). ***P<0.005. (B) Representative immunoblot (top) and analysis (bottom) of the effects of GFX (0.5 µM) and fasudil (1 µM) on PKCα cytosolic levels (n = 6). **P<0.01, ***P<0.005, vs. control; #P<0.05 vs. PDBu plus GFX. (C, top panels) PKCα distribution (PKCα, green; cell nucleus, blue) in a representative femoral smooth muscle cell under resting conditions (control) and after stimulation with PDBu (0.2 μM) for 5 and 10 min. Scale bar represents 8 µm. (C, bottom panels) Fluorescence intensity analyses (averaged peripheral (Fm):cytosolic (Fc), Fm/Fc) for different Z sections in control solution and at different times (5 and 10 min) in PDBu (n = 9). ***P<0.005 vs. Z-section 1. (D) Isometric force developed in response to PDBu (0.2 µM) in the presence of the PKCα inhibitor GFX (0.5 µM) (left) or GFX plus fasudil (1 µM) (right). The asterisk illustrates the lack of effect of fasudil. (E) Dose-response curves of the cumulative vasorelaxant effects of GFX alone (●) (n = 8) or in the presence of 1 µM fasudil (▲) (n = 6). The inset shows the lack of effect of fasudil (1-5 µM) on the PDBu-induced contraction. Dose-response curves were fitted to a logistic equation using nonlinear regression analysis tools provided in SigmaPlot software. Statistical significance was calculated by by one-way ANOVA or Kruskal-Wallis test followed by either Student-Newman-Keuls t-test, Tukey, or MannWhitney U test, where appropriate. *P<0.05, **P<0.01, ***P<0.005.